

 |
Lissajous curves in motion |  |
 |
The graphics below are generated with Graphics Explorer, my equations grapher program.
Theory.
|
|
|
He is famous for his research on waves and oscillations.
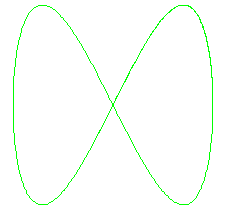
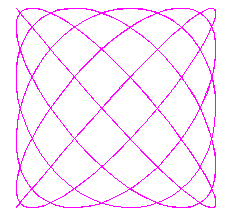
A particular kind of graphs are called "Lissajous curves",
3 examples are pictured right.
Lissajous curves are made by so called "parametric functions".
"common" functions, like y = 5sin(x) , produce a -single- y value for a value of x.
So, it is not possible to make graphs of spirals or even a circle, which needs 2 -y-
values for each value of x.
Parametric functions overcome this limitation by the following tric:
instead of y = f(x) we write:
y = g(v) and x = h(v)
so x and y are both functions of a new variable v.
(Graphics-Explorer uses v, often this variable is called t)
An example:
if y = 5sin(v) , x = 5cos(v) and v has domain 0..6.28 (2*p radians), the plotted curve
is a circle with centre (0,0) and a radius of 5.
In general:
| a Lissajous curve is the graph of a parametric function with both x and y being trigonometric functions of v |
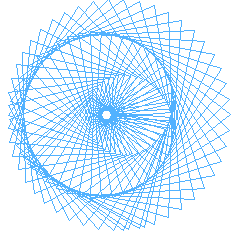
Molested Lissajous curves.
|
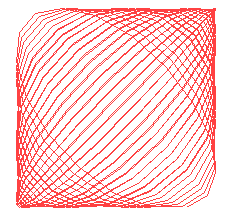
Lissajous curves, like common functions, will be smooth, without sharp angles.
The picture right is the result of the steps of v being too large.
This is how GraphicsExplorer paints parametric functions:
| 1. | stepvalue of v = (endvalue - startvalue)/number of steps |
| 2. | calculate (x,y) coördinates using startvalue of v |
| 3. | increment v by stepvalue |
| 4. | calcalute next (x,y) and draw line to previous (x,y) coördinates |
| 5. | repeat steps 3..5 until endvalue of v is reached |
If the steps are too large, straight lines with angles instead of smooth curves will result.
Practice.
Start program Graphics-Explorer or goto [ Graphics-Explorer ] page first.(download program by clicking on download (lightning) logo at top of page).
Select AUTOPLOT and REPLACE modes.
Type :
y = 5sin(v) ; x = 5cos(v)
and press ENTER.Set start = 0 , end = 10 en steps = 100. Press ENTER
A circle with centre (0,0) and radius of 5 is plotted.
Erase graphics by menu:general:restart.
Type :
y = 5sin(a*v) ; x = 5cos(b*v)
Type ENTER or click PLOT button.
Move mousepointer over constants A and B and press (and hold) left or right mousebutton.
As the constants change, the function will be repaint, using the new values.
More accurate variations are obtained by decreasing the constants (+/-) increment value.
A higher number of steps for v will produce smoother curves.
Try this:
y = c*sin(a*v) ; x = c*cos(b*v)
Constant c is de size of the graphic.
Other Curves.
Interesting curves and artwork can be created by combining movements.Type:
y = 5sin(a*v) + c*sin(b*v) ; x = 5cos(a*v) + c*cos(b*v)
A point rotates over a circle with radius = 5. The speed is a (radians/v).
This point is the centre of a circle with a radius of c.
The pen moves over this second circle with a speed of b.
Some examples:
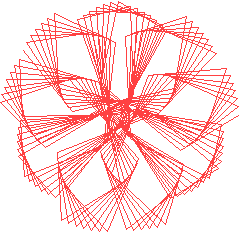
| y = 3sin(a*v)+c*sin(b*v) ; x = 3cos(a*v) + c*cos(b*v) | |
| start = 0 end = 10 steps = 200 | |
| A=8.4 B=96.41 C=3 | A=13.81 B=42.1 C=3 |
| 
|
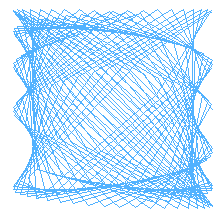
Another example.
Type:
y = c*sin(a*v)(1 + sin(b*v)) ; x = c*cos(a*v)(1 + sin(b*v))
This represents a point moving over a circle with a speed of a (radians/v).
The radius of the circle is modulated by the factor (1 + sin(b*v)).
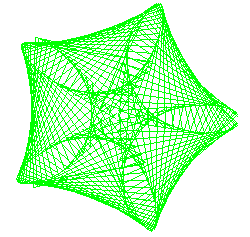
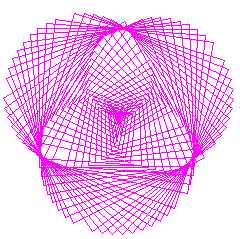
| y = c*sin(a*v)(1 + sin(b*v)) ; x = c*cos(a*v)(1 + sin(b*v)) | |
| start = 0 end = 10 steps = 200 | |
| A=30 B=11.88 C=3 | A=100 B=25 C=3 |
| 
|
Also, graphics of different formula's and colors can be combined.
Use menu:graphics:color to select other colors for background, grid or curves.
Success and have fun!
Note
Design artist Jennifer Townley builds machines that draw Lissajous curves.Visit her website [HERE]


