

 |
 |
Graphics-Explorer Explore, plot, print, calculate equations and functions |
 |
 |
Graphics Explorer version 3 is available, look [ HERE ]
Major changes are
-
- coordinate system 800*800 pixels
- superscript formula editing: x2 instead of x^2
Graphics Explorer is a versatile and powerfull program to plot, print or investigate graphs, equations and functions.
Besides the graphing of different type of functions, Graphics Explorer also is able to find
the best fitting polynomial or exponential function given a set of points.
Equations may contain constants (a,b,c) that can be changed by a mouseclick.
Graphs adjust instantly which illustrates the role of constants as in y = a*sin(b*x + c) ,
where a,b,c are amplitude, frequency and shift of phase.
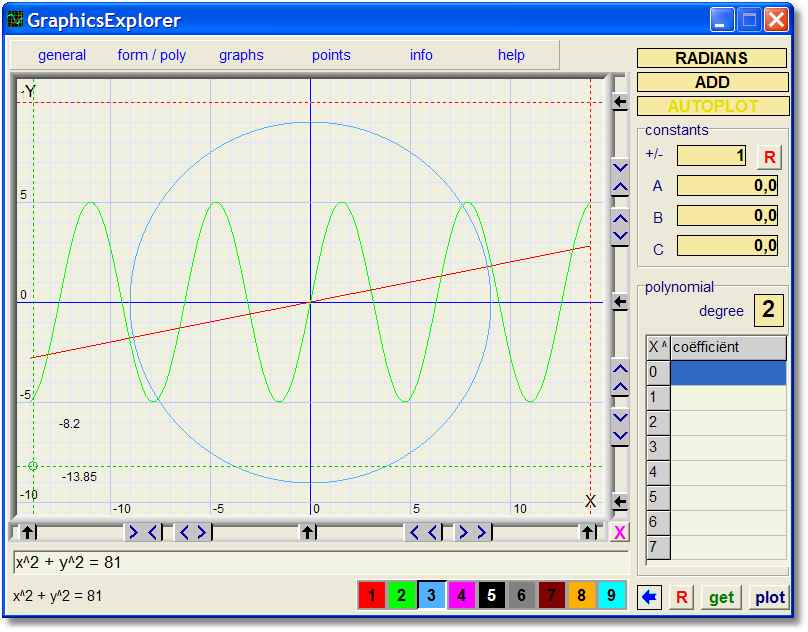
Below is a picture of the program at work.
Just plotted are
-
y = 0.2x....... y = 5sin(x) ....... x^2 + y^2 = 81
Specifications
-
- coördinate system 600 * 450 pixels
- reflections
- integration
- differentiation
- sum, difference, product
- 7 sizes
- black / white or colored
- with / without backgroundcolor
- crosshairs with (x,y) indication
- 9 different colors and formulas
- scrolling and zooming with mouseclick, x/y independent
- add or delete dots with mouseclick or by table editing
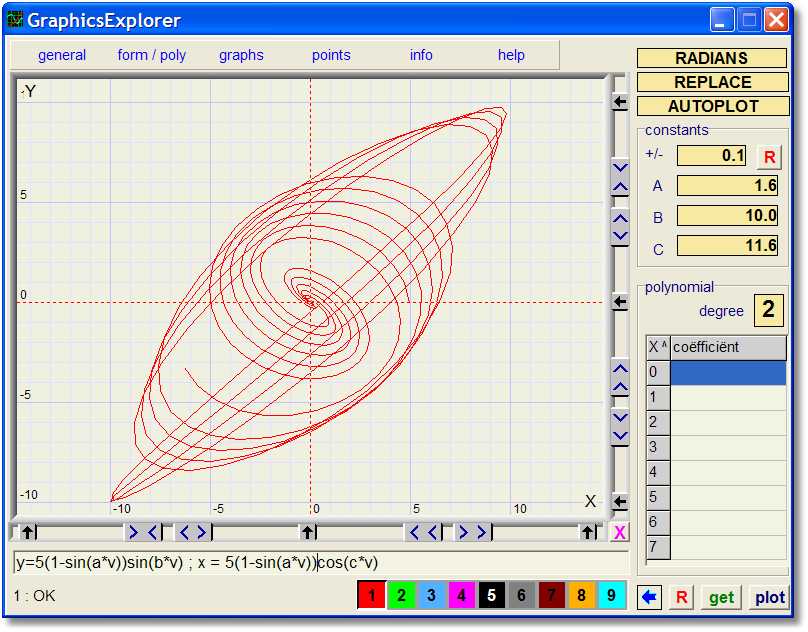
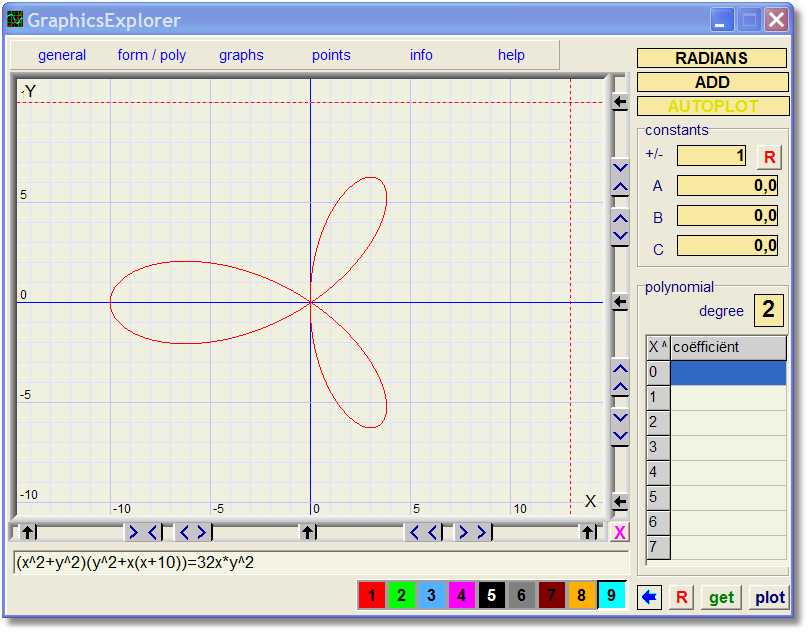
- recognizes 4 types of equations:
| type | example | description | |
|---|---|---|---|
| 1 | y = f(x) | y = 3cos(5x) | function |
| 2 | x = f(y) | x = (y-1)^2 | inverse |
| 3 | y = f(v) ; x = g(v) | y = 5sin(2v) ; x = 7cos(3v) | parametric |
| 4 | f(x) = g(x) | (x^2+y^2)(y^2+x(x+10))=40x*y^2 | implicit |
- enter polynomials, degree 0..7, in "coefficient" table
- operations on polynomials:
- a,b,c changable by mouseclick, graphics adjust automatically
- plot function (type 1) 1..3 times differentiated
-
by simply preceding it by d:, dd: or ddd: .
example: y = d:sin(2x)
-
by simply preceding it by i: .
example: y = i: 5sin(x)
- compute polynomial of degree 0..7 through 1..40 dots.
- compute exponential functions through set of dots
| y = a.b^x | y = a.b^x + c | |
| y = a.e^(bx) | y = a.e^(bx) + c | |
| y = e^(ax^2 + bx + c) | ||
- add personal heading to plots and prints.
- save / reload user settings
- save / reload formulas
- copy graphic image to clipboard
- print graphics
- in line help documentation
- 484kB (.exe) file
- for Windows 95 and up
- screen minimal 800*600 pixels
- no installation procedure, no changes in Windows Registry.
Examples
1. Polynomial (degree 3) given 4 points: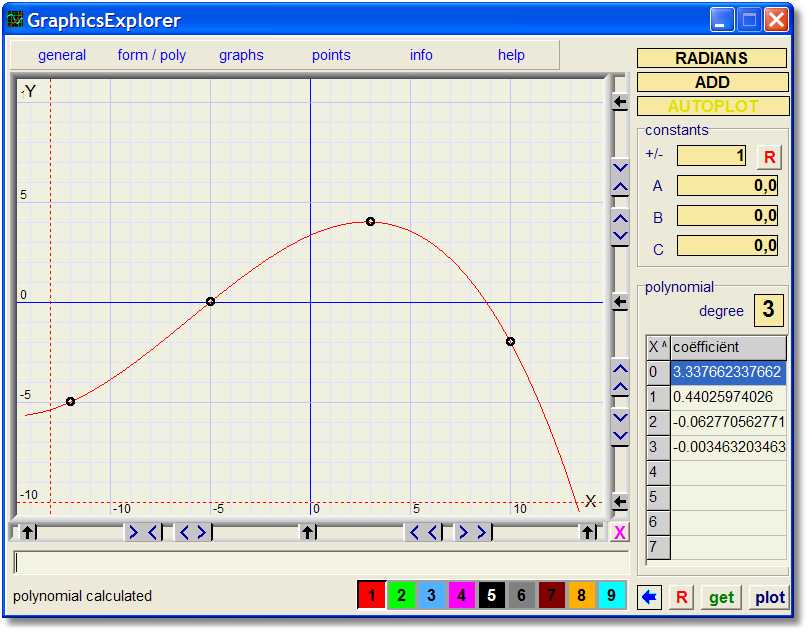
Installation
Click on the download icon (lightning) at the top of this page to load Graphics Explorer.There is no installation procedure, just copy the .exe file to a map of choice.
Graphics Explorer is written for Windows.
Programming language is Delphi.


